
Diagnostic report
A diagnostic report gives Dew support the details they need to troubleshoot a problem with your server, so they don’t have to ask you for each one.
Send a report
Section titled “Send a report”-
Open System → System, and on the System tab click Download diagnostic report. Your browser saves a file named
dew-diagnostics-YYYY-MM-DD.zip.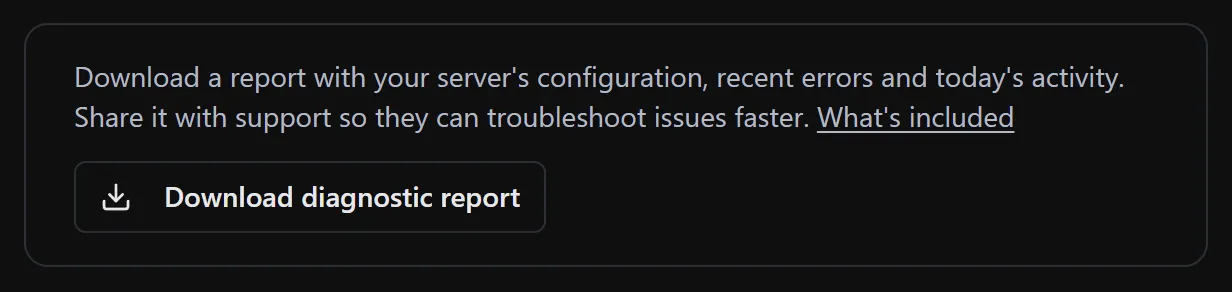
-
Email the file to support@getdew.io with a short description of the problem. If an error showed a code such as
REF-a3f8b2c1, include it.
Turn on debug logging
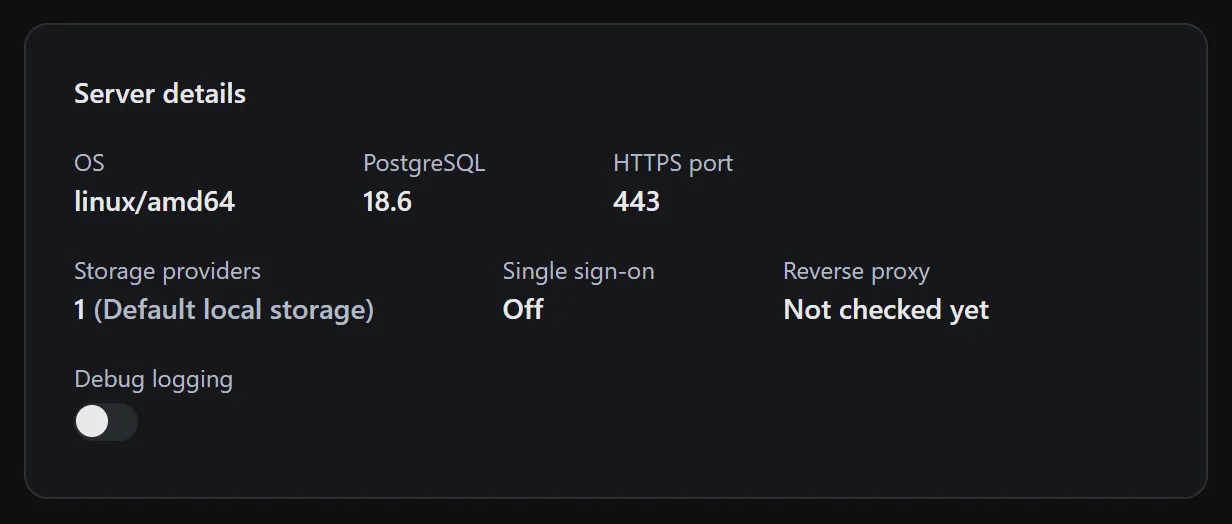
Section titled “Turn on debug logging”If support asks for debug logging, open System → System and, under Server details, turn on Debug logging. It turns itself off after 24 hours, or when Dew restarts. Reproduce the problem, then download the report.
What it contains
Section titled “What it contains”- Your server’s setup: Dew and database versions, uptime, proxy settings, license details, domains and certificates, email configurations and storage providers.
- Warnings and errors from the last seven days, up to 10,000 of them.
- The last 5,000 lines Dew logged since it last started, including debug details while debug logging is on.
- Today’s access log: the time, IP address, web address, status and duration of each request.
- Codes in shared links, upload links and other access links are replaced with short codes, and email addresses and phone numbers are shortened.
- Passwords and client secrets are left out. IP addresses, user IDs, file names and a shortened form of your license key are included.